
Out of the seeming randomness of stock market prices, order spontaneously emerges, creating meaningful patterns that traders can exploit to give them an edge. Since Steve Nison introduced Japanese candlestick chart analysis to the West, traders in the United States have been using it to make sense of these patterns. One of the most exciting patterns is the three white soldiers.
What are the Three White Soldiers?
The three white soldiers is a pattern used in candlestick chart analysis. It occurs across three trading periods and reflects a reversal of a bear market and a shift to a bull market. On a candlestick chart, they appear as three long white candlesticks trending upward, reflecting open prices more significant than the previous open price. This signal is especially strong when the open price on a given trading session is in the middle range of the previous day’s prices. The closing prices should also trend upwards, creating successive highs in the near term.
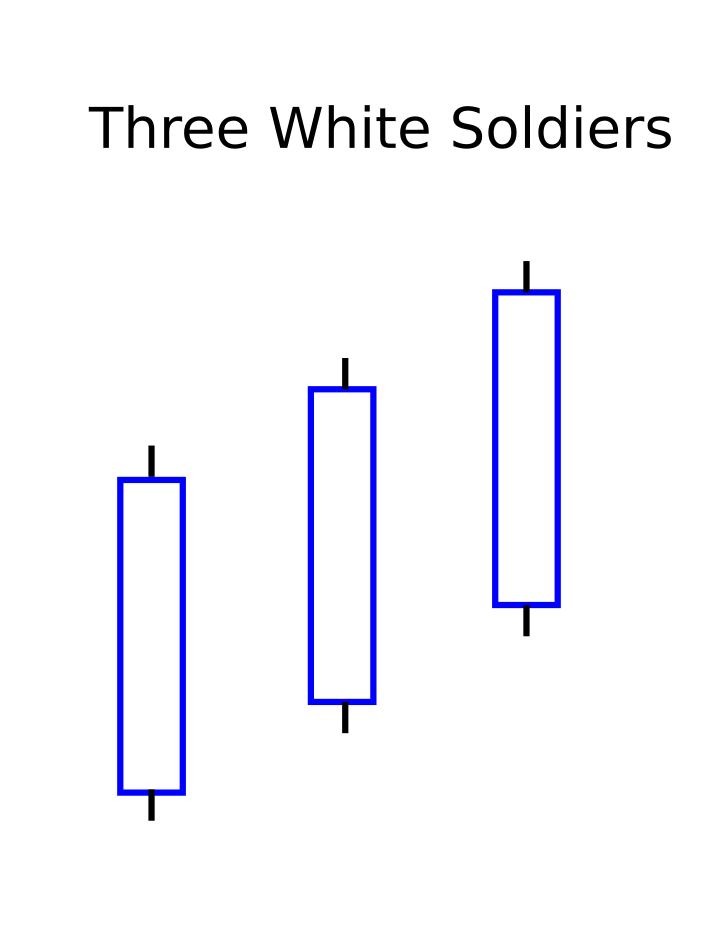
Source: Wikipedia
The three white soldiers signal that a bear market has found its floor and has ended. If we zoom out, the 2020 stock market crash is the kind of event we are looking at. On 20 February 2020, global stock markets crashed, with indices such as the Dow Jones Industrial Average (DJIA) depicted below, collapsing dramatically in response to the unprecedented Covid-19 pandemic. This led to a bear market that lasted until 7 April 2020, when a bull market suddenly emerged.
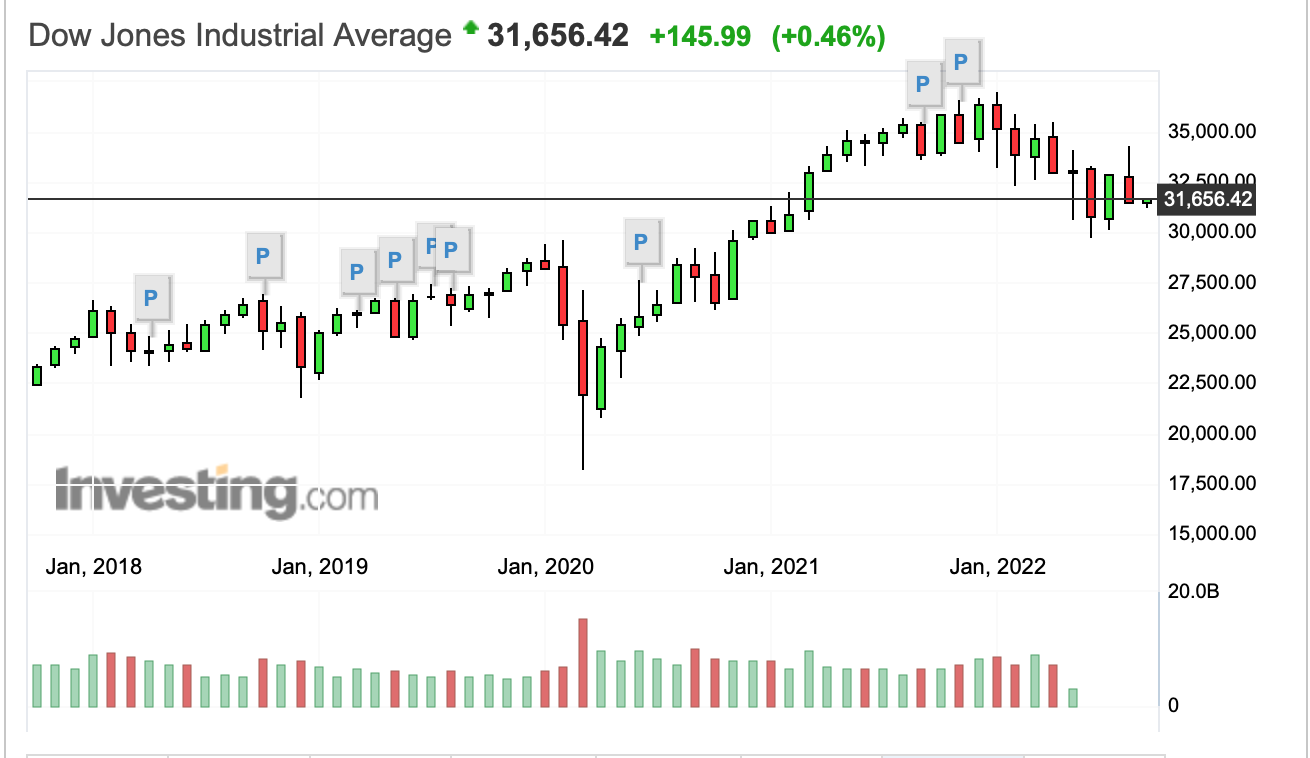
Source: Investing.com
The three white soldiers help traders look for signals that a bear market has ended. They tell us that market sentiment has improved, optimism has returned, and demand for stocks is rising. Price formation is both complex and simple. It’s about supply and demand. Supply is fairly static, given share buybacks and the fact that even if new businesses enter public markets, many also exit public markets. Prices change wildly in response to demand. Benjamin Graham referred to the manic-depressive nature of Mr. Market, who sometimes bids too much for stocks, and sometimes, too little. The three white soldiers depict Mr. Market’s evolution from depression to mania.
Trading The Three White Soldiers
The three white soldiers don’t appear all the time. They are really rare trading signals, so when you see them, you have to sit up and take notice because something big is likely to happen when they do appear. One study found that the three white soldiers appear in just one of every 3,000 candles. However, the study also showed that when it does appear, it tends to be a very reliable signal that a bullish trend is emerging to reverse a bear market, with that being the case 90% of the time.
Depending on your position, the three white soldiers are either a signal to exit the market or to enter it. If you’re looking to go long, the pattern tells you to jump in and take a position. If you’re short, it tells you to exit your position.
Risks in Trading the Three White Soldiers
Although it is a reliable indicator 90% of the time, there is still a 10% chance that that is not the case. In the markets, mistakes are severely punished, so you should not trade the three white soldiers alone. You need to have an appropriate framework to look at various strands of evidence to see if your thesis will hold.
The best way to limit your risk is to use bet sizing. Use the Kelly criterion to tell you how much of your capital you should risk, given your estimate of your chances and the odds the market offers, as implied by the market’s pricing. The Kelly criterion can be simplified to mean edge/odds, where edge represents how much you think you can win, and odds are what the market says you will win if you win. To calculate it, you need to figure out your probability of winning; start with a base rate of 90% (based on the study we mentioned), but adjust that upwards or downwards using Bayesian updating, to come up with a final probability.
You also need the probability of winning, which is just 100% minus the probability of winning, and, the potential payoff. All these inputs are estimates, but they will help you size your bets, given your information. The stronger the signal, give the more evidence you collect, the bigger the bet you make. If you don’t have an edge, the Kelly criterion tells you to stay away from the market.
There are several ways that a trade can go wrong. For instance, if you use the signal in isolation, you could find that it signals not a bull market but a period of market consolidation. Volume is an important consideration. If the volume isn’t on the reversal side, and the new highs are being pushed on thin volumes, then the reversal does not have enough support to survive. The reversal could easily be reversed. You need to analyze the market with a wealth of tools. Use candlestick patterns, technical indicators, and fundamental analysis to get you over the line.
The Uniqueness of The Three White Soldiers
One of the unique things about the three white soldiers is that it doesn’t have any gaps. What you have are three candlesticks appearing in quick succession. So long as there are gaps, there is no three-white soldiers pattern. However, if there are gaps, it may still be worth looking at.
Gaps happen whenever a trading session opens with markedly higher or lower prices than the previous session. This doesn’t happen with cryptocurrencies because they are traded continuously. When there are gaps in crypto, it’s because the volumes are very thin. Liquidity is essential because when volumes are low, you are less likely to find someone willing to buy your assets at the price you bought them for, and so, prices tend to be very low because there’s so much risk. Gaps are much more common in the stock or commodity markets, which have fixed trading hours. Then, if something important happens outside trading hours, that will affect how traders perceive that asset, and lead to a big change in pricing, and therefore, create a gap in price charts.